PART I: THE REST OF AFRICA
Answer two questions in this part
1. a) Draw a sketch map of Ghana and on it mark and label:
i) Cocoa growing areas,
ii) Towns; Kumasi,Accra and Takoradi,
iii) Routes showing cocoa movement in Ghana,
iv) Lake Volta
b) Describe the factors that have favored the growing of cocoa in Ghana
c) Explain the benefits of cocoa growing to the people of Ghana
d) Outline the problems facing the agricultural sector in Ghana.
2. Study Fig 1 map of Botswana provided and answer the questions that follow.
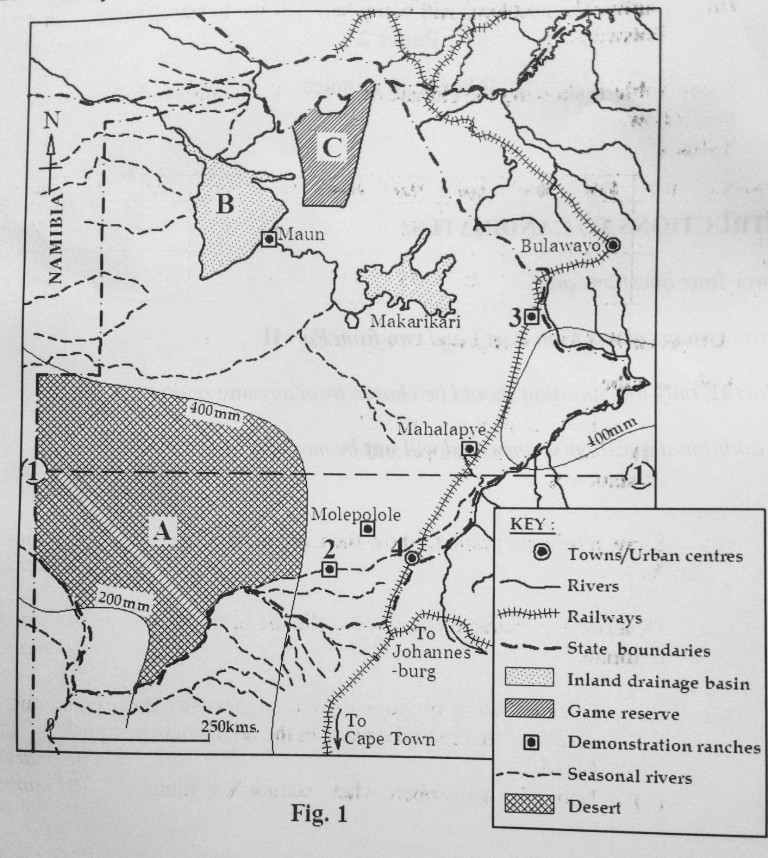
a) Name the :
i) deser marked A
ii) inland drainage basin marked B
iii) game reserve marked C
iv) latitude marked I
v) demonstration ranches marked 2 and 3
vi) urban centre marked 4
b) Describe the condition that led to the establishment of emonstration ranches in Botseana.
c) Explain the contribution of the livestock industry to the development of Botswana
3. Study Table 1, showing the climate of station X and answer the questions that follow.
Table 1
|
Months |
Jan |
Feb |
Mar |
Apr |
May |
Jun |
July |
Aug |
Sept |
Oct |
Nov |
Dec |
|
Temp in C0 |
22 |
24 |
27 |
32 |
31 |
27 |
26 |
25 |
26 |
26 |
25 |
23 |
|
Rainfall in mm |
- |
- |
- |
25 |
75 |
125 |
200 |
325 |
150 |
25 |
- |
- |
Adapted: W.J Minns: A geography of Africa (page 36)
a) Calculate the:
i) mean annual rainfall and
ii) mean annual temperature
of station X
b) Draw a suitable graph to show the temperature and rainfall of station X.
c) Describe the characteristics of the climate of the area where station X is found.
d) i) Giving reasons for your answer, suggest any three economic activities that can take place in the area where station X is found.
ii) Name the hemisphere where station X is found.
4. a) Using relevant diagram, distinguish between gill-netting and purse-seining methods of fishing.
b) Describe any two methods of preserving fish used in Africa
c) Explain the benefits of the fishing industry in any African country
d) Outline the environmental problems resulting from fishing activities in Africa.
PART II: STUDIES IN DEVELOPMENT
Answer two questions from this part, choosing only one question from any on region
REGION I: NORTH AMERICA
5. Study Table 2, showing the St. Lawrence Seaway monthly traffic results (in tones) for April 2017 and answer the questions that follow:
Table 2
|
Type Cargo |
Traffic (in tones) for April 2017 |
|
All grain |
880,000 |
|
Iron Ore |
798,000 |
|
Coal |
239,000 |
|
Dry bulk e.g Cocoa, Sugar |
1,077,000 |
|
Liquid bulk (Oil fuel, Chemicals, Fats) |
346,000 |
|
General Cargo |
360,000 |
|
Total Cargo |
3,700,000 |
Adapted: TheSt. Lawrence Seaway Management Corporation: Seaway Monthly Traffic results April 2017
a) Draw a bar graph to represent the information in the table
b) Calculate the percentage of traffic contributed by:
i) All grain and
ii) General cargo
to the total cargo traffic for April 2017
b) Explain the conditions that have made the St. Lawrence Seaway an important traffic route.
d) What problems are still being faced by the Great Lakes and the St. Lawrence Sea-way?
6. Draw a sketch map of California and on it mark and label:
i) Rivers: Sacremento and Friant,
ii) Shasta dam,
iii) any one oil field and any one gas field,
iv) industrial centres Los Angeles and San Franciso
b) Identify any three categories of industries found in California.
c) Describe the factors that favored the development of industries in California.
7. Study Fig 2, map of Tennessee River Valley and answer the questions that follow
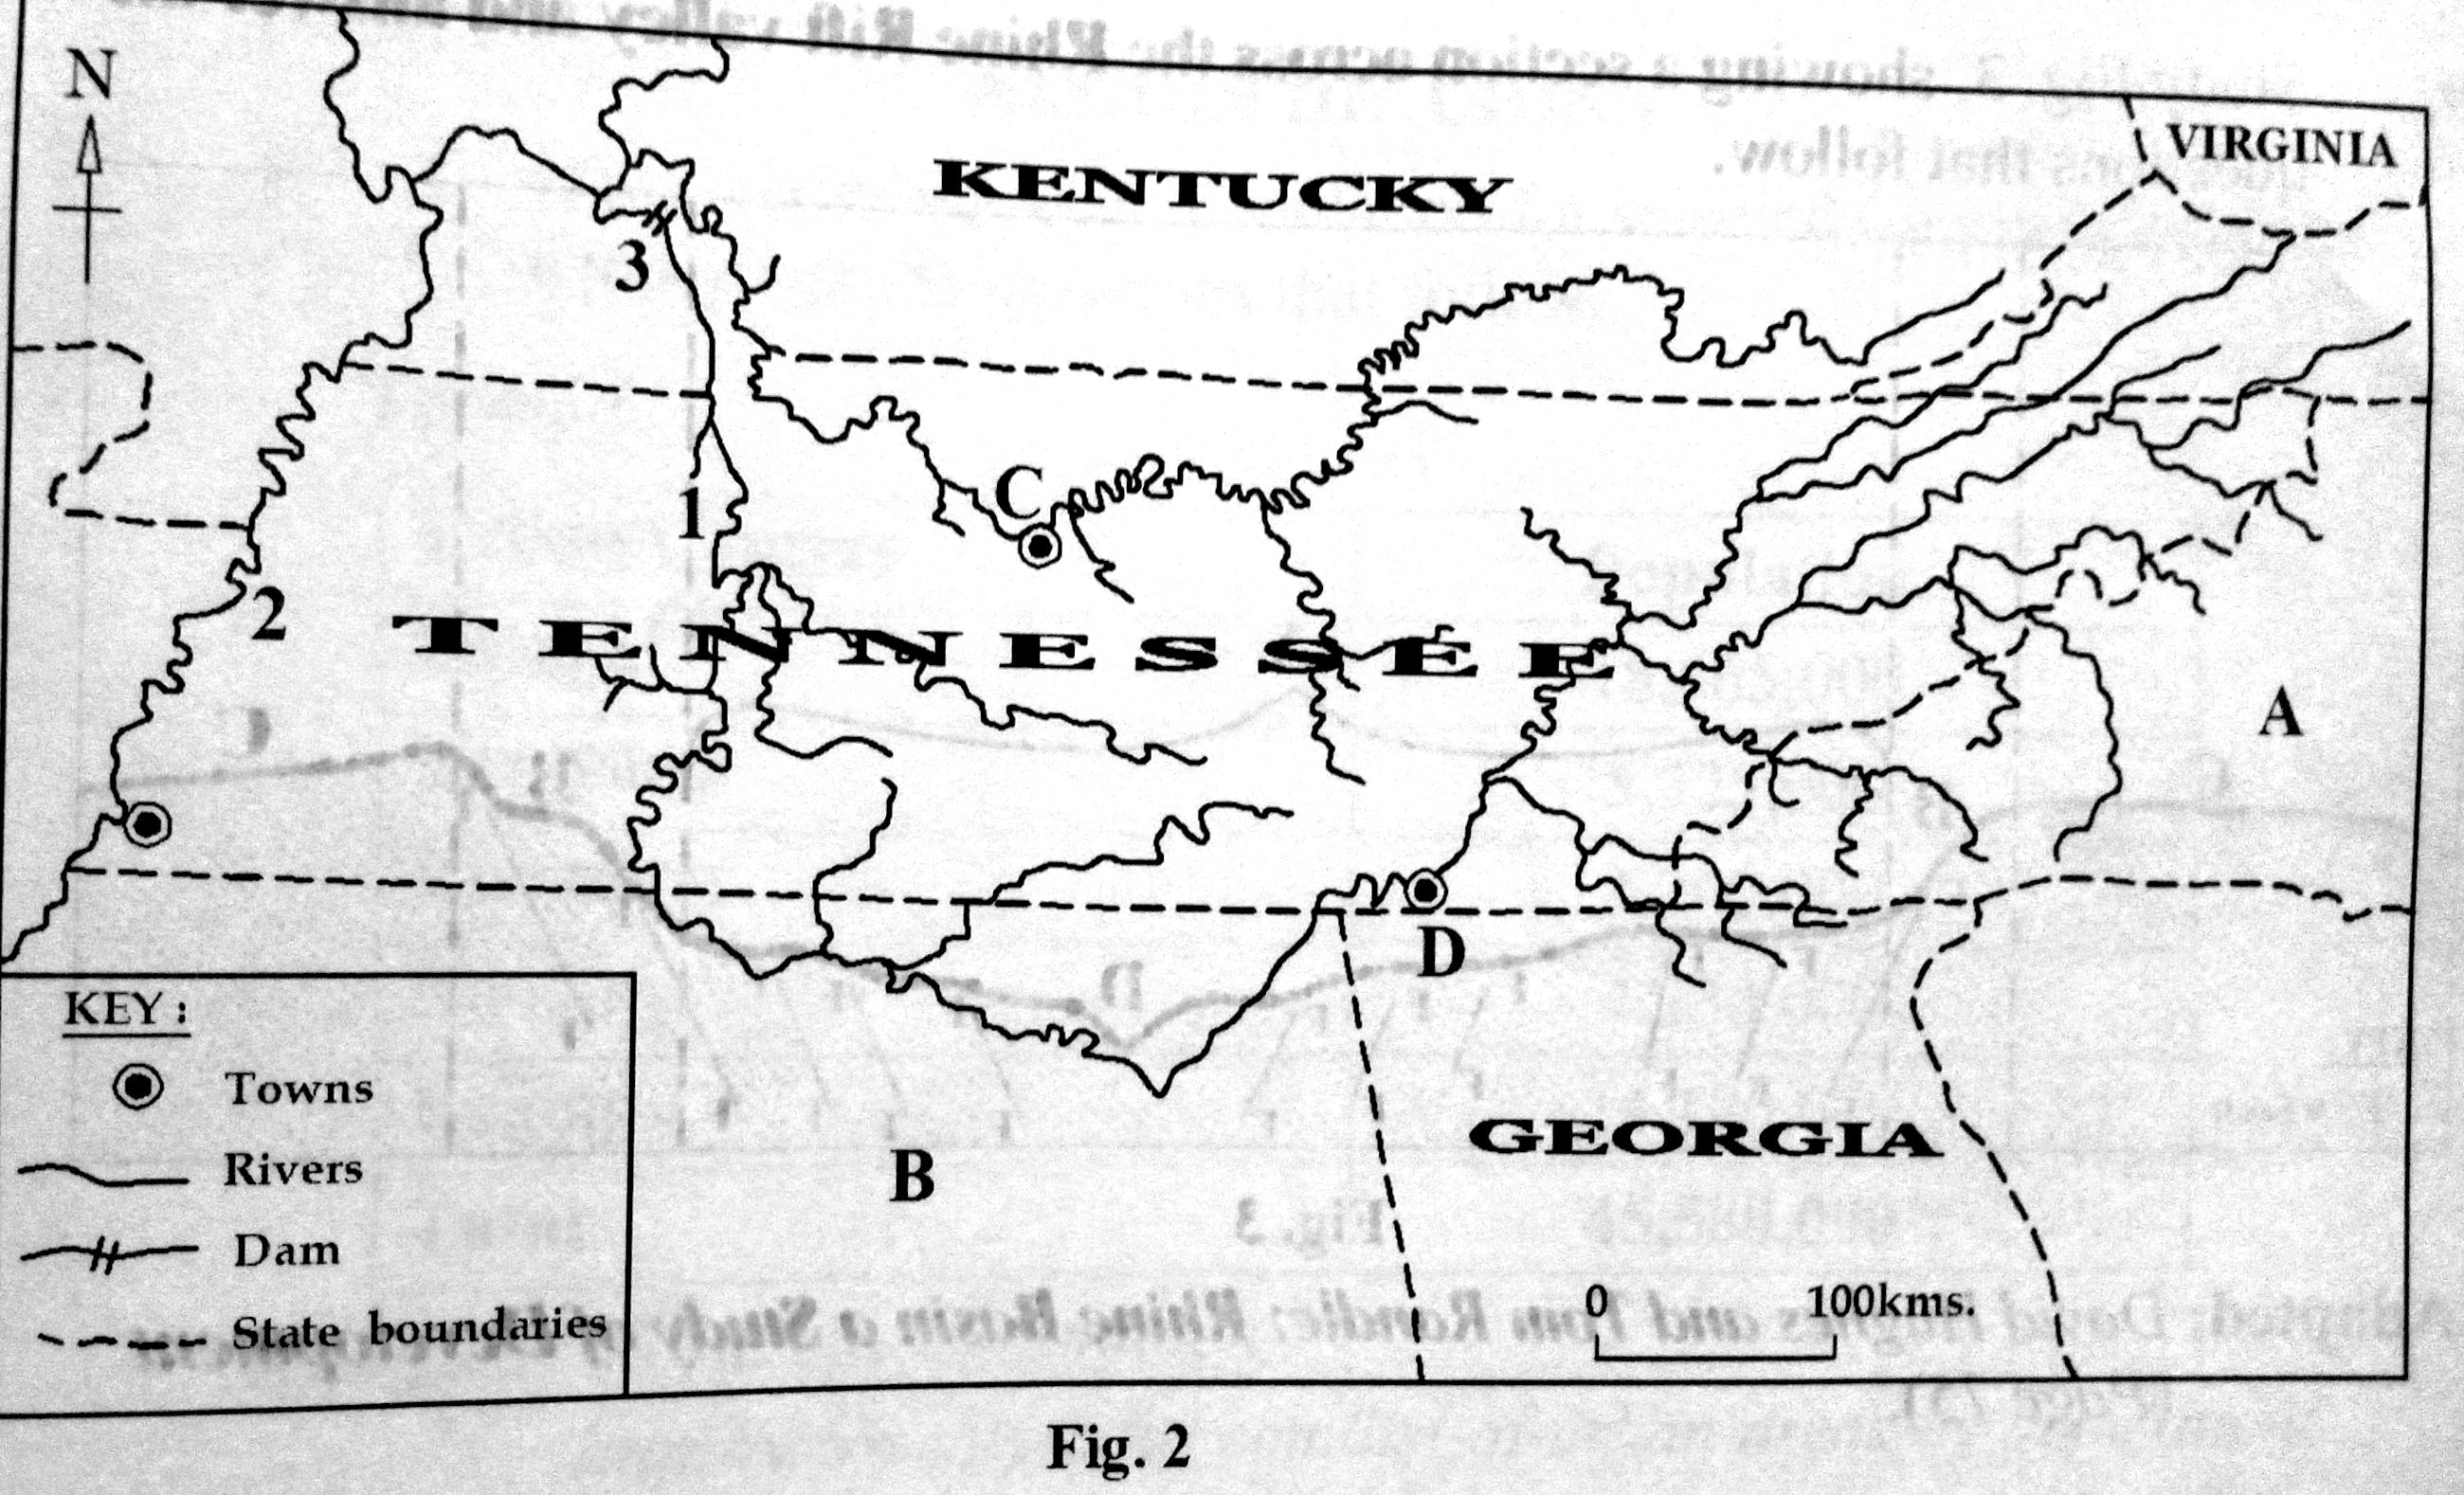
a) Name the:
i) Rivers marked 1 and 2
ii) Dam marked 3,
iii) States marked A and B
iv) Urban centres marked C and D
b) Describe the problems that faced the Tennessee River Valley before the establishment of the Tennessee Valley Authority (TVA)
c) Explain the contribution of the Tennessee Valley Authority to the development of the Tennessee River Valley.
d) Outline the problems still facing the people living in the Tennesse River Valley.
REGION II: RHINELANDS
8.a) Draw a sketch map of the Ruhr mining region of Germany and on it mark and name:
i)The Ruhr river,
ii)Canals: Dortmund Ems canal and Wesel Dattein canal,
iii) Concealed coal fields and Exposed coal fields,
iv) Mining centres: Bochum and Duisburg
b) Describe the factors which favored the growth tof the mining sector in the Ruhr region of Germany.
c) Explain the environmental problems resulting from mining activities in the Ruhr region of Germany.
d) Outline the measures being taken to improve the mining sector in the Ruhr region.
9. Study Fig 3, showing a section across the Rhine Rift valley and answer the questions that follow.
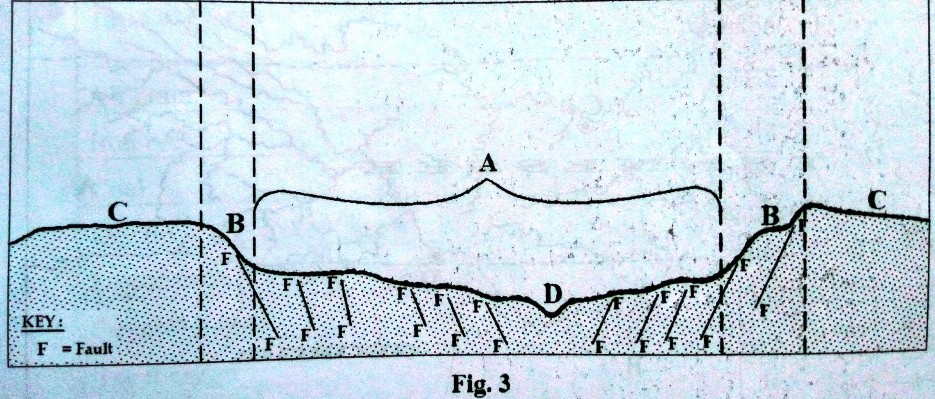
Adapted: David Hughes and Tom Randle: Rhine Basin a Study of Development (Page 75)
a) Name:
i) the physical regions marked A, B and C,
ii) river marked D
iii) any two crops grown in region A
iv) any one type of land use in region marked C
b) Describe the physical conditions that have favored the growing of crops in the Rhine Rift Valley.
c) Outline the problems faced by the farmers in the Rhine Rift Valley.
d) What steps have been taken to improve farming in the Rhine Rift Valley?
10.a) Draw a sketch map to show the location of Rotterdam Entrport and on it mark and name:
i) The North Sea,
ii) Distributaries: The Waal and Mass,
iii)Rhine Scheldt canal,
iv) Ports: Rotterdam and Amsterdam
b) Explain the factors favoring the development of Rotterdam as an entreport.
c) What challenges are faced by the people using Rotterdam port?
d) Outline the steps being taken to solve the challenges stated in (c) above.
REGION III: CHINA
11. Study Table 3, showing urban population for selected Chineseurban centres in 2011 and answer the questions that follow.
Table: 3
|
Urban Centres |
Population |
|
Shangai |
18,665,000 |
|
Shenyang |
5,325,000 |
|
Kumming |
3,200,000 |
|
Nanging |
4,230,000 |
|
Beijing |
14,170,000 |
|
Total |
45,580,000 |
Adapted:World City Information;
http://www.city-infos.com/list-of-urban-areas-by-population/
a) Draw a pie-chart to represent the urban population of the selected cities in China.
b) Identify the urban centre with the:
i) large population,
ii) lowest population
c) Explain the conditions that have led to the growth of urban centres in China.
d) Describe the problems faced by the people living in large cities in China.
12. Study fig 4, mapof China provided and answer the questions that follow
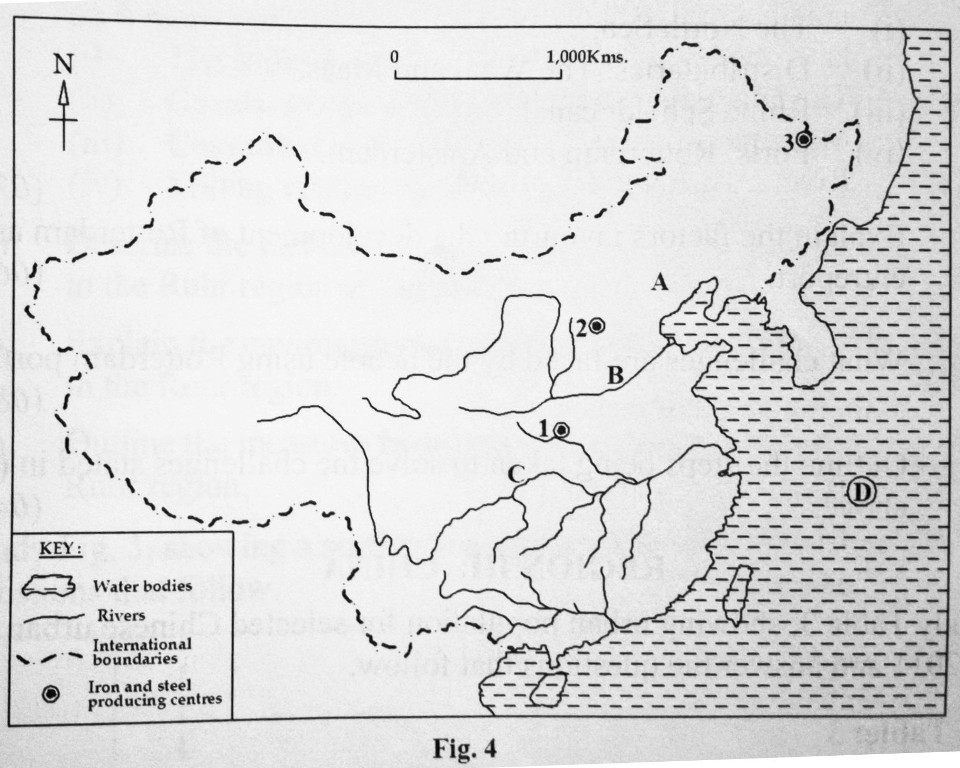
a) Name:
i) any two minerals found in the industrial centre marked A,
ii) rivers marked B and C,
iii) water body marked D
iv) iron and steel producing centres marked 1, 2 and 3
b) Describe the factors which led to the development of the Iron and steel industry in China.
c) Explain the problems faced by the people living in the industrial region marked A on the map
d) Suggest measures that China should take to solve the problems identified in (c) above.
13. a) Draw a sketch map of China and on it mark and name:
i) land below 1,500 metres anove sea level,
ii) land above 4,000 metres above sea level,
iii) The Himalayas mountain ranges,
iv) Manchurian plain,
v) Rivers: Xi Jiang, Chang Jiang and Huang He.
b) Describe the process that led to the formation of the Himalayas mountains
c) Explain the value of either the;
i) Himalayas mountains or
ii) Manchuria plain
to China
d) Outline the problems faced by the people living in any one river basin in China
END