PART I: THE REST OF AFRICA
Answer 2 questions in this part
1. a) Draw a sketch map to show the location of the Gezira Irrigation Scheme and on it mark and name:
i) Rivers: Blue Nile and White Nile,
ii) Dams: Jabel Aulia and Sennar dam,
iii) Irrigated areas: Gezira and Managil extension
iv) Town: Khartoum
v) Main Canal
b) Describe the factors that led to the establishment of the Gesira Irrigation Scheme in Sudan.
c) Explain the problems that resulted from the establishment of the irrigation scheme.
d) Mention any two dominant crops grown on the irrigation scheme
2. Study figure 1, map of Africa provided and answer the questions that follow.
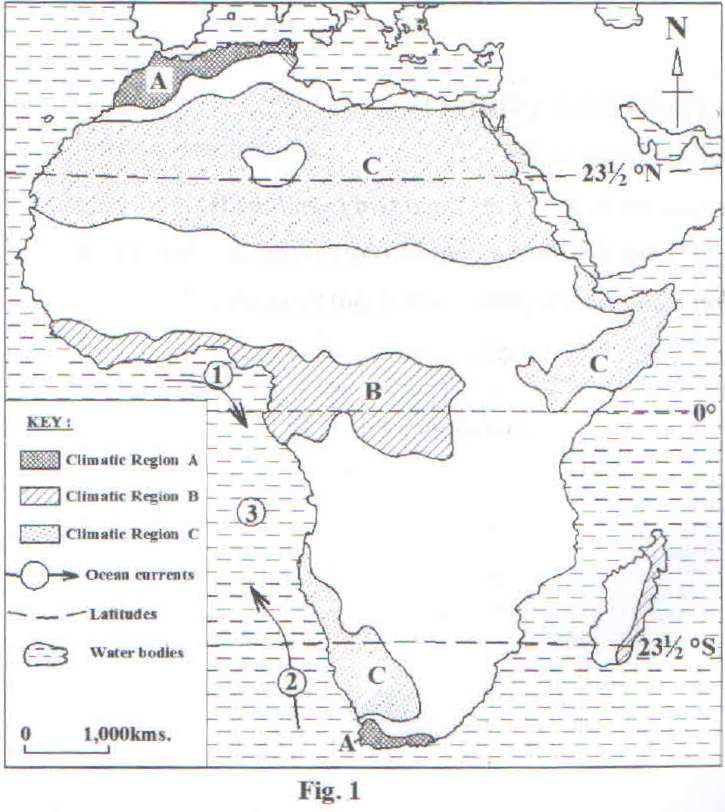
a) Name the:
i) climatic regions marked A, B and C
ii) warm ocean current marked 1
iii) cold ocean current marked 2
iv) water body marked 3
b) Describe the characteristics of either warm ocean currents on the climate of Africa
d) Outline the disadvantages of living either in climatic region marked B or climatic region marked C.
3. Study table I below, showing the population figures of some selected African countries in 2014 and answer the questions that follow.
Table 1
|
Country |
Population size (in millions) |
|
Malawi |
16.7 |
|
Ghana |
26.8 |
|
Algeria |
38.9 |
|
South Africa |
54.0 |
|
Democratic Republic of Congo |
74.9 |
|
Nigeria |
177.5 |
Adopted: World Development Indicators 2016 (pages 48-52)
a) Draw a bar graph to represent the information given in the table.
b) Identify the country with the:
i) largest
ii) smallest
population.
c) Describe the factors that have led to a large population size in any one country given in the table.
d) Outline the:
i) problems,
ii) advantages
of a large population size in the country chosen.
4. a) Name any two types of:
i) marine
ii) fresh
water fish species caught in Africa.
b) Describe any one method used to catch deep sea fish in Africa.
c) Giving specific examples, explain the problems faced by the fishing industry in Africa.
d) Suggest the steps that should be taken to improve the fishing industry in Africa.
PART II : STUDIES IN DEVELOPMENT
Answer two questions from this part
REGION I : NORTH AMERICA
5. Study table 2 below showing British Columbia’s Forest Product Export value in billion Canadian dollars for the period between 2011 and 2015; and answer the questions that follow.
Table 2
|
Years |
Total Export value in billion Canadian dollars |
|
2011 |
9.98 |
|
2012 |
10.16 |
|
2013 |
11.65 |
|
2014 |
12.40 |
|
2015 |
12.88 |
Adopted: BC Stats. Tabulation from Statistics Canada: Ministry of Forests, Lands and Natural Resource Operations 2016.
a) Draw a line graph to represent the information in the table.
b) i) Calculate the percentage change in the export value between 2011 and 2015
ii) Name any two forestry products exported by British Columbia between 2011 and 2015.
c) Explain the factors favoring the development of the forestry sector in British Columbia.
d) Outline the problems faced by the forestry sector in British Columbia.
6. a) Draw a sketch map of the Southern United Stated of America (USA) and on it mark and name:
i) the old cotton growing states: Georgia, Albama, and Mississipi
ii) new cotton growing states: California, Arizona and Texas
b) Explain the problems that faced the old cotton belt in the 19th Century.
c) What steps did the cotton farmers take to improve cotton growing in the south?
d) Outline the contribution made by the cotton growing industry to the development of U.S.A
7. Study the figure 2, map showing the site of New York and answer the questions that follow.
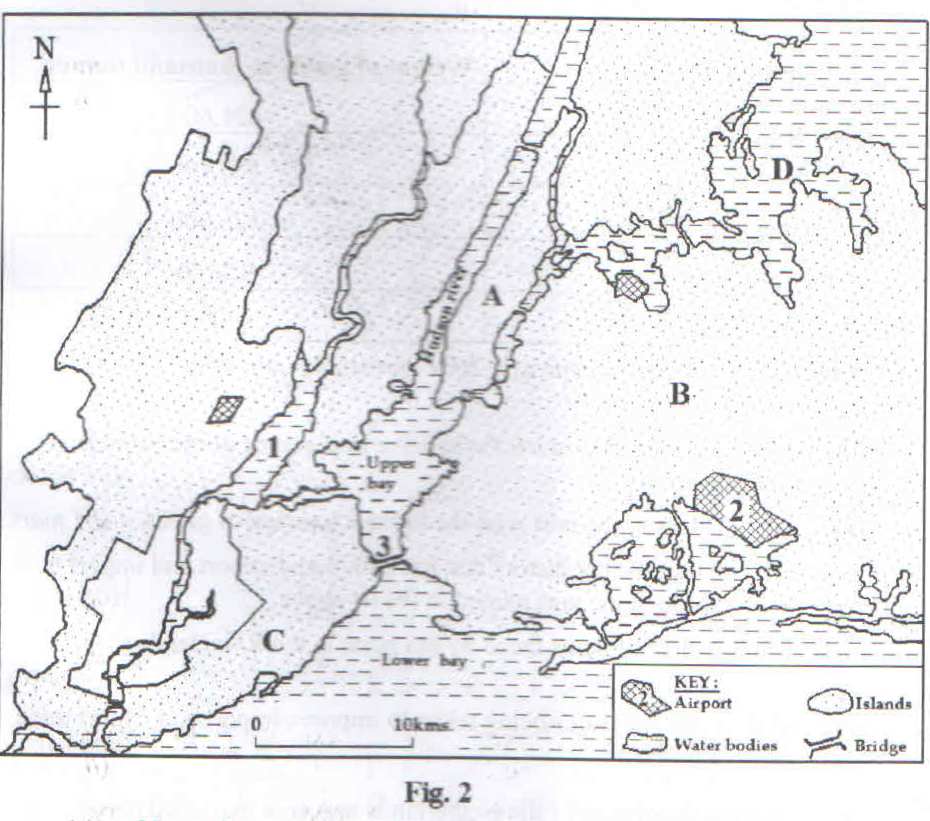
a) Name the:
i) Islands marked A, B and C
ii) river marked D
iii) bay marked 1
iv) airport marked 2
v) bridge marked 3
b) Explain the factors that led to the development of New York as a port.
c) Describe the effects of the development of New York port on the physical environment.
d) What steps are being taken to improve New York?
REGION II: RHINELANDS
8. Study table 3 below, showing the weight of goods (in thousand tones) handled by selected maritime Rhineland’s ports in 2014 and answer the questions that follow.
Table 3
|
Cargo Port |
Weight of goods in thousand tones |
|
Rotterdam |
421,600 |
|
Antewarp |
180,400 |
|
Humburg |
126,000 |
|
Amsterdam |
97,100 |
|
Bremerhaven |
53,600 |
Adopted: ec europa.eu/eurostat.2014 eurostat news release No 184/2016 28 September 2016
a) Draw a pie chart to show the relative importance of the Rhinelands maritime ports.
b) i) identify the port with the highest tonnage of goods.
ii) Describe the factors that have favored export and import trade through the port named in (b) (i) above.
c) Explain the problems faced by sea ports in the Rhinelands region.
d) Outline the measures being taken to improve import and export trade in the Rhinelands.
9.a) Draw a sketch map of the Netherlands and on it mark and name:
i) the North Sea,
ii) rivers: Meuse and Sheldt,
iii) ports: Rotterdam and Amsterdam,
iv) canals: North canal
b) Describe the conditions that led to the development of the Delta plan.
c) Explain the benefits of the Delta project to the Netherlands.
d) Outline the problems that resulted from the establishment of the Delta project.
10. Study figure 3, part of map of Europe showing the location and position of Switzerland and answer the questions that follow.
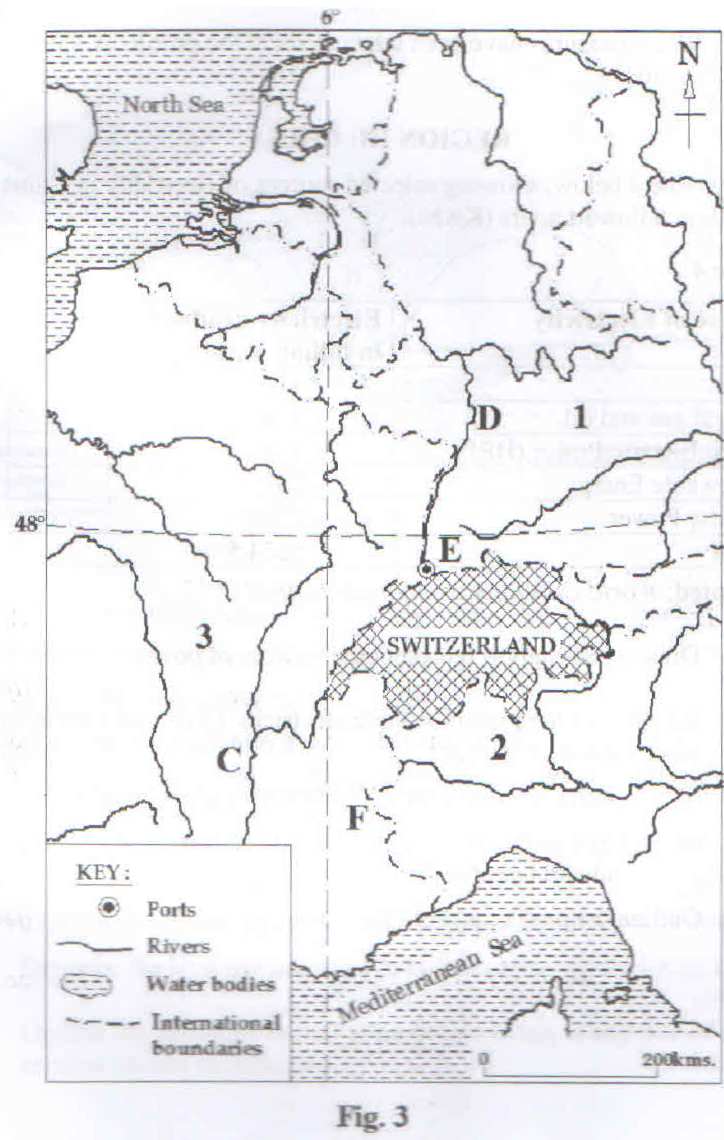
a) Name the:
i) countries marked 1, 2 and 3
ii) rivers marked C and D
iii) inland port marked E
iv) relief feature found in the area marked F
b) How has Switzerland benefited from her location in the centre of Europe?
c) Explain the problems faced by Switzerland as a landlocked country.
d) What measures have been taken to solve the problems stated in © above?
REGION III: CHINA
11. Study table 4 below, showing selected sources of electricity in China in 2014 in billion Kilowatt hours (Kwhs).
Table 4
|
Source of Electricity |
Electricity production in billion Kwhs |
|
Coal |
4113.3 |
|
Natural gas and oil |
124.6 |
|
Hydro Electric Power (HEP) |
1,054.0 |
|
Renewable Energy |
232.3 |
|
Nuclear Power |
130.3 |
|
Total |
5654.5 |
Adopted: World Development Indicators April 2017
a) Draw a pie chart to represent to represent the sources of power in China.
b) Why does China produce more electricity from coal than from all the other sources of energy?
c) i) Name any one area in China where coal is produced.
ii) Explain the role of coal in the development of China’s industrial sector
d) Outline the problems faced by the energy sector in China.
12. Study figure 4, map of China showing the distribution of mean-annual rainfall and answer the questions that follow:
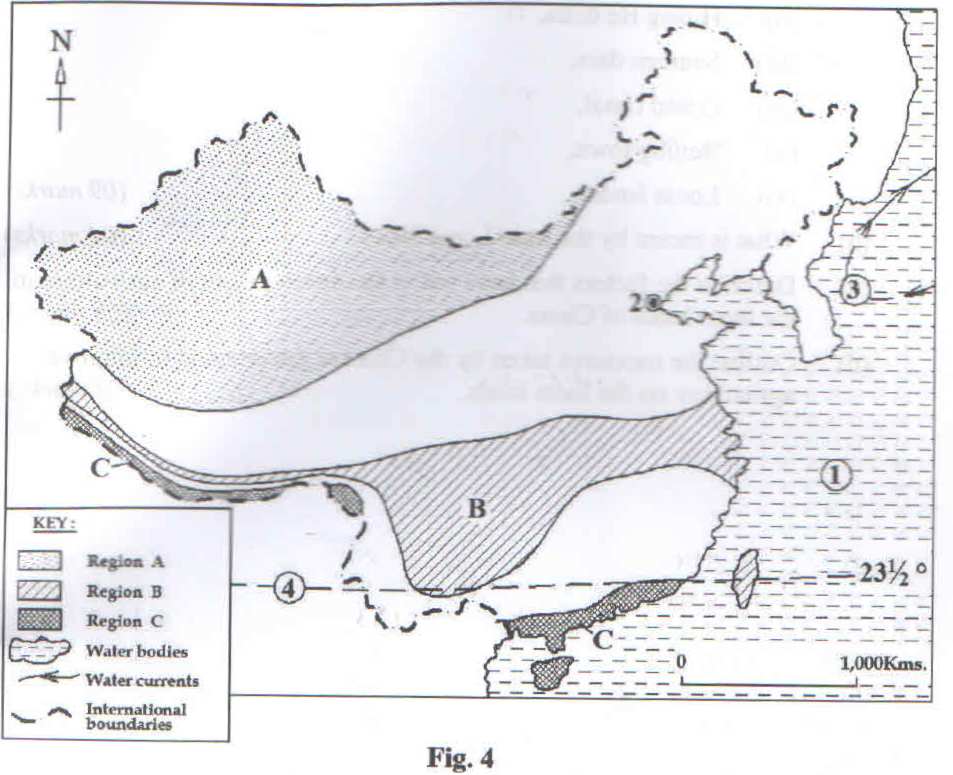
a) Name the :
i) sea marked 1,
ii) urban centre marked 2
iii) current marked 3
iv) latitude marked 4
v) rainfall regions marked A, B and C
b) Explain the causes of:
i) low rainfall in the region marked A,
ii) heavy rainfall in either region marked B
iii) current marked 3
iv) latitude marked 4
v) rainfall regions marked A, B and C
b) Explain the causes of:
i) low rainfall in the region marked A,
ii) heavy rainfall in either region marked A or B
d) Outline the problems faced by the people living in any one of the regions chosen in (c) above.
13 a) Draw a sketch map of North China and on it mark and name:
i) Rivers: Huang He, Fen He and Wei He,
ii) Huang He delta
iii) Sanmen dam,
iv) Grand canal
v) Beijing town
vi) Loess Islands
b) What is meant by the term Loess lands?
c) Describe the factors that have led to the development of agriculture in the loess lands of China.
d) Outline the measures taken by the Chinese government to improve agriculture on the loess lands.