PART 1: THE REST OF AFRICA
Answer two questions in this part
1. Draw a sketch map of Africa and on it, mark and name:
a) i) the Equator(latitude 00),
ii) ocean currents: Mozambique and Canary,
iii) areas with: Equatorial, Mediterranean and Semi- desert climatic
b) Describe the characteristics of either the Equatorial or Semi- desert type of climate.
c) Describe the conditions which have led to the type of climate chosen in (b) above.
d) Explain the influence of climate on human activities in any one area in (a) (ii) above.
2. Study Table I below showing sugar production in the Republic of South Africa and answer the questions that follow.
Table I: Sugar Production in the Republic of South Africa (2005/6 – 2001/12)
|
Year |
’000 Metric Tonnes |
|
2005/6 |
17,000 |
|
2006/7 |
16,000 |
|
2007/8 |
16,000 |
|
2008/9 |
15,500 |
|
2009/10 |
15,000 |
|
2010/11 |
14,000 |
|
2011/12 |
14,000 |
Adapted: http//www.illovosugar.co.za/world-of-sugar-statistics South Africa
a) Draw a bar graph to show the information in the table above.
b) i) Describe the trend in sugar production in the Republic of South Africa between 2005/6 and 2011/12.
ii) Explain the causes of the trend in sugar production in the Republic of South Africa between 2005/6 and 2011/12
c) Explain the contribution of sugar production to the development of the Republic of South Africa.
d) i) Name any one province in the Republic of South Africa which is important for sugar-cane growing
ii) Suggest the measures that should be taken to improve sugar production in the Republic of South Africa.
3. Study Figure 1: Map showing the Tazara (Tanzam) railway and answer the questions that follow.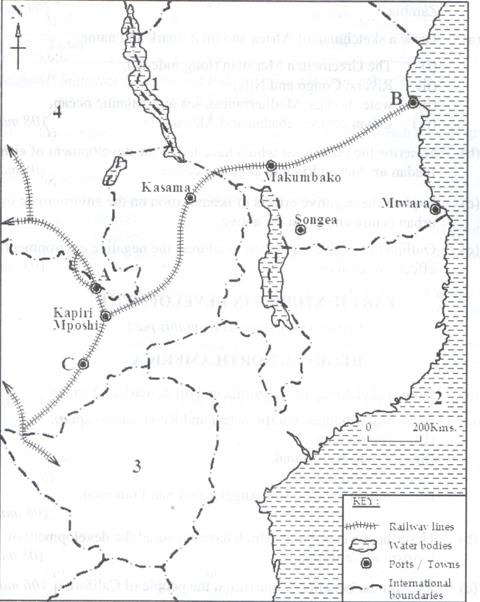
a) Name the:
i) water bodies marked 1 and 2
ii) countries marked 3 and 4
iii) towns marked A,B and C
b) Describe the role of the Tazara railway in the development of Zambia
c) Explain the problems facing the transport sector in Zambia
d) Outline the steps being taken to improve the transport sector in Zambia
4. a) Draw a sketch map of Africa and on it, mark and name:
i) The Greenwitch Meridan (longitude 00),
ii) Rivers: Congo and Nile
iii) water bodies: Mediterranean sea and Atlantic ocean
iv) Urban centers: Ibadan and Alexandria
b) Describe the conditions which have led to the development of either Ibadan or Alexandria into an urban center.
c) Explain the negative effects of urbanization on the environment in the urban centre chosen in (b) above.
d) Outline the steps being taken to address the negative environmental effects in (c) above.
PART II: STUDIES IN DEVELOPMENT
Answer two questions from this part
REGION I: NORTH AMERICA
5 a) Draw a sketchmap of California and on it, mark and name:
i) water bodies: Pacific ocean and River San Joaquin
ii) Shasta dam
iii) Friant-Kern canal
iv) Coastal ranges
v) tourist centres: Los Angeles and San Franciso
b) Describe the conditions which have favored the development of tourism in California.
c) Explain the benefits of tourism to the people of California
d) Outline the steps being taken to improve tourism in California.
6. Study Table II below showing grain production in Canada (2013/14) and answer the questions that follow.
|
Type of Grain |
Production (’000 MetricTonnes) |
|
Wheat |
31,000 |
|
Barley |
10,000 |
|
Rye |
200 |
|
Oats |
4,000 |
|
Corn |
14,000 |
|
Total |
59,200 |
Adapted: Statistics Canada and Industry Consultation. p9
www.rayglen.com/pdf/Canada
a) Draw a pie-chart to show the relative importance of each type of grain in Canada.
b) Identify:
i) the type of grain which is produced in
-largest
-smallest
quantities in Canada
ii) Name any three provinces which produce grains in Canada
c) Describe the conditions which have favoured the growing of grains in the Canadian provinces idenfied in b (ii) above.
d) Outline the challenges faced by farmers growing grains in Canda.
7. Study Figure 2: Map showing the Old and New industrial regions of New England and answer the questions that follow.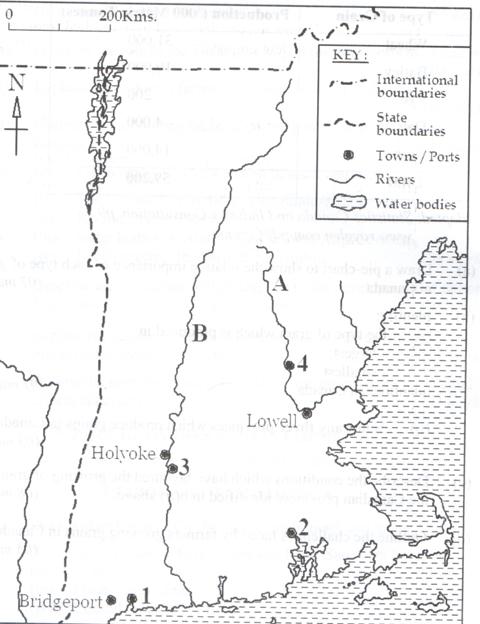
a) Name the;
i) rivers marked A and B
ii) old industrial towns marked 1 and 2
iii) new industrial towns marked 3 and 4
b) Describe the conditions which have led to the decline of industries in the old industrial region.
c) Explain the benefits of industries to the states of New England
d) Outline the environmental problems that have resulted from industrialization in New England.
REGION II:RHINELANDS
8. a) Draw a sketch map of Switzerland and on it, mark and name:
i) the three physical region named in (a) (i) above
ii) River Rhine
iii) Lake Zurich
iv) any one land use type in each physical region named in (a) (i)
b) Describe the influence of physical factors on land use in Switserland
c) Explain the problems facing land use in the Alpine region of Switzerland.
d) Outline the steps being taken to solve the problems in (c) above.
9. Study Figure 3: Map showing the Zuider Zee reclaimed areas and answer the questions that follow.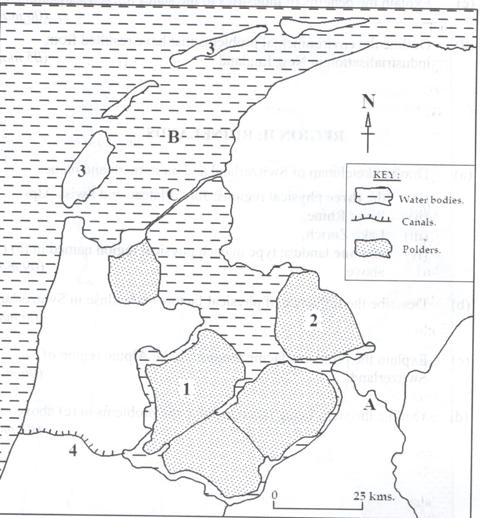
a) Name the:
i) polders marked 1 and 2
ii) water bodies marked A and B
iii) islands marked 3
iv) dyke marked C
v) canal marked4
b) Explain the conditions which necessitated the establishment of the Zuider Zee polders.
c) Describe the steps taken to reclaim land from the sea in The Netherlands
d) Outline the problems which resulted from the establishment of polders in the Netherlands.
10. Study Table III showing cereal production in Belgium (’000 tonnes) in 2013 and answer the questions that follow.
|
Cereal Crop |
Production (’000 Tonnes) |
|
Rice |
37 |
|
Wheat |
1,844 |
|
Rye |
3 |
|
Barley |
391 |
|
Maize |
838 |
|
Others |
43 |
|
Total |
3,156 |
Adapted: Eurostat: Agriculture, forestry and fisheries
Statistics(online data code Apro- cpp crop) p 83
a) Draw a pie-chart to show the relative importance of each cereal crop in Belgium.
b) Calculate the percentage contributed by:
i) wheat
ii) maize
to the total cereal production in Belgium.
c) Describe the factors which have favored the growing of cereals in Belgium.
d) Outline the steps being taken to improve the agricultural sector in Belgium.
REGION III: CHINA
11. Study table IV below showing the climate statistics of Hong Kong and answer the questions that follow.
|
Month |
J |
F |
M |
A |
M |
J |
J |
A |
S |
O |
N |
D |
|
Temp (0C) |
16 |
15 |
17 |
21 |
25 |
27 |
29 |
28 |
27 |
25 |
20 |
17 |
|
Rainfall (mm) |
33 |
44 |
73 |
135 |
288 |
386 |
375 |
355 |
252 |
113 |
43 |
30 |
Adapted: D.C. Money (1989) China: The Land and the People. P 169
a) Draw a suitable graph to show the information given in the table
b) Describe the characteristics of the climate of Hong Kong
c) Explain the factors that have influenced the climate of Hong Kong
d) Outline the problems faced by the people living in the area where this station is found.
12. Study Figure 4 showing the Yunman region of China and answer the questions that follow: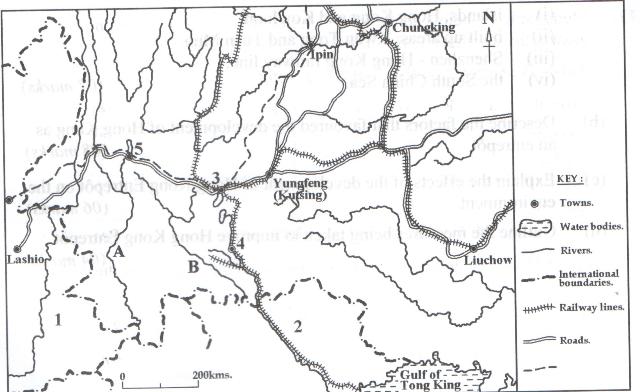
a) Name the:
i) rivers marked A and B
ii) countries marked 1 and 2
iii) towns marked 3,4 and 5
b) Describe the human activities taking place in the Yunnan region of China
c) Explain the problems faced by the people living in the Yunnan region of China
d) Suggest measures that should be taken to develop the Yunnan region of China.
13. a) Draw a sketch map showing the site of Hong Kong Entrpot and on it mark and name:
i) islands: Hong Kong and Kowloon
ii) built up areas: Kwun Tong and Tuen Mun
iii) Shenzhen – Hong Kong railway line
iv)the South China Sea
b) Describe the factors that favored the development of Hong Kong as an entrepot.
c) Explain the effects of the development of Hong Kong Entrepot on the environment.
d) Outline the measures being taken to improve Hong Kong Entrepot.
END