PART 1: THE REST OF AFRICA
Answer two questions in this part
- a) Draw a sketch map of Egypt and on it, mark and name:
- River Nile
- towns: Aswan, Suez and Alexandria
- areas with a population density of over 1,000 people per km2
- areas with a population density of less than 3 people per km2
b) Describe the factors which have led to a high population density in the areas marked in (a) (iii) above.
c) Explain the challenges faced by people living in the densely populated areas in Egypt.
d) Outline the steps being taken to address the challenges in (c) above.
2.Study figure 1, the sketch map of Liberia and answer the questions that follow.
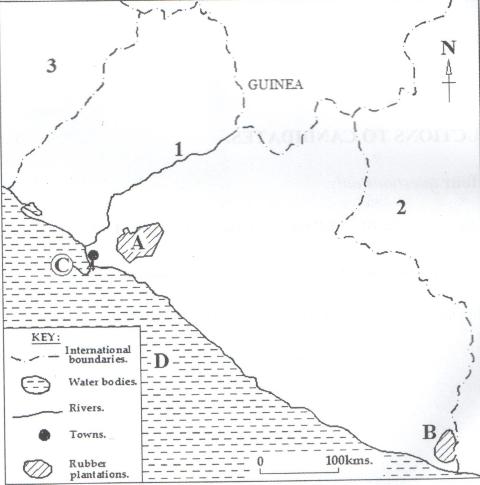
- Name the:
- rubber plantations marked A and B
- river marked 1
- countries marked 2 and 3
- port marked C
- water body marked D
- Describe the physical factors which have led to the development of plantations farming in Liberia
- Explain the problems faced by plantation farmers in Liberia.
- Outline the steps being taken to improve plantation farming in Liberia
3. Study table I below, showing changes in forest cover for selected countries in Africa (1990 – 2010) and answer the questions that follow.
|
Country |
Forest Area as a percentage of Total Land Area |
||
|
1990 |
2000 |
2010 |
|
|
Cameroon Zambia Swaziland Dem. Rep. Congo Nigeria Gabon |
51.4 70.0 27.4 70.7 18.9 85.4 |
46.8 68.8 30.1 69.4 14.4 85.4 |
42.1 66.5 32.7 68.0 9.9 85.4 |
Table 1
Adapted: Africa Development Indicators, 2012/13. The World Bank, Washington D.C .p.57
- Calculate the percentage change in forest cover for each country between 1900 and 2010
- Draw a bar graph to show the percentage area under forest cover for the selected African countries in 2010.
- i) Identify the country with the highest forest destruction
ii) Explain the causes of the high rate of forest destruction in the country identified in (c) (i) above
d.Outline the effects of forest cover destruction in Africa.
4. Study Figure 2 below, showing the railway system in the Democratic Republic of Congo (DRC) and answer the questions that follow.
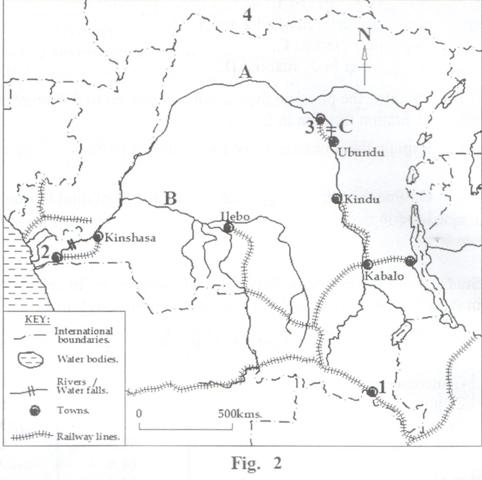
- Name the:
- rivers marked A and B
- waterfalls marked C
- towns marked 1,2 and 3
- country marked 4
- Describe the factors which have influenced the development railway transport in DRC.
- Explain the role of railway transport in the development of DRC
- Outline the steps being taken to improve the transport sector in DRC.
PART II: STUDIES IN DEVELOPMENT
Answer two questions from this part
REGION I: NORTH AMERICA
5. Study table II below, showing the climate of Edmonton on the Canadian Prairies and answer the questions that follow.
|
Months |
J |
F |
M |
A |
M |
J |
J |
A |
S |
O |
N |
D |
|
Temp (0C) |
-15 |
-12 |
-4 |
5 |
11 |
14 |
16 |
16 |
10 |
5 |
-4 |
-10 |
|
Rainfall (mm) |
23 |
15 |
18 |
20 |
20 |
81 |
89 |
61 |
36 |
18 |
18 |
20 |
Adapted : Monkhouse, F.J and Cain H.R (1979) Geographies: A Certificate Series; North America, Longman p.31
- Draw a suitable graph to represent the climate of Edmonton.
- i) Identify the coolest and driest month at Edmonton station.
ii) Determine the annual range of temperature and mean annual rainfall for Edmonton station.
c. Explain the influence of climate on agricultural activities on the Canadian Prairies.
d.Outline the benefits of the agricultural sector to the people of Canada.
6. a) Draw a sketch map of the Great Lakes region and on it, mark and name:
- the St. Lawrence river
- Lake Michigan
- Welland canal
- Industrial centres: Quebec, Cleveland and Duluth.
b) i) Mention any two types of industries found in any one industrial centre named in (a) (iv) above.
ii) Describe the factors which have favored the development of industries in the Great Lakes region.
c) Explain the benefits of industrialization in the development of Great Lakes region.
d) Outline the steps being taken to improve the industrial sector in the Great Lakes region.
7. Study figure 3 below, showing part of British Columbia and answer the questions that follow.
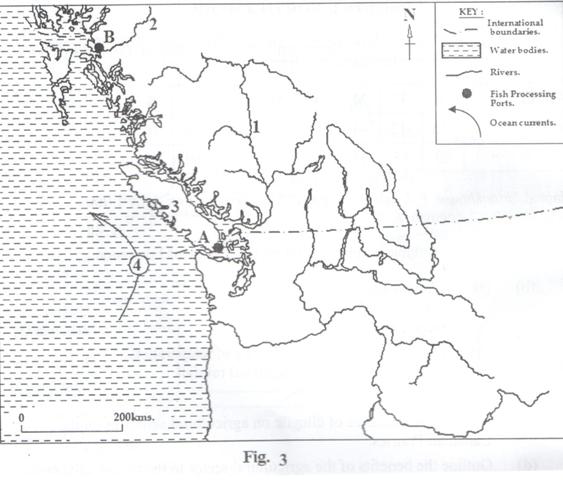
- Name the:
- rivers marked 1 and 2
- fish processing ports marked A and B
- island marked 3
- ocean current marked 4
b. i) Mention any two types of fish caught in British Columbia
ii) Describe any one commercial deep sea fishing method used in British Columbia
c. Explain the factors which have favored the development of the fishing industry in British Columbia.
d. Outline the problems faced by the fishing industry in British Columbia
REGION II: RHINELANDS
8. Study table III, showing overnight tourist stays in selected Communes in Switzerland and answer the questions that follow.
|
Region |
Commune |
Overnight stays(‘000s) |
|
Alps |
Lugarno St Moritz |
600 800 |
|
Jura |
Basel |
1,000 |
|
Plateau |
Zurich Lucerne Geneva |
2,500 980 1,900 |
|
Total |
7,780 |
|
Adapted from: Swiss Tourism Statistics, FS0 (2010) p26
- Draw a pie-chart to show Switzerland’s overnight tourist stays by Communes.
- Determine the percentage of overnight tourist stays for each region in Switzerland
- Explain the factors which have favored tourism in the region with the highest overnight stays in Switzerland.
- Outline the benefits of the tourist industry in Switzerland.
9. a) Differentiate between dairy farming and arable farming
b) Draw sketch map of The Netherlands and on it, mark and name:
- towns: Amsterdam, Rotterdam and the Hague
- the North sea
- any one major arable farming area
- any one major dairy farming area
c) Describe the physical factors that have led to the development of diary farming in Netherlands
d) Explain the benefits of dairy farming to the people of the Netherlands.
10. Study Figure 4, showing industrial centers in Luxembourg and answer the questions that follow
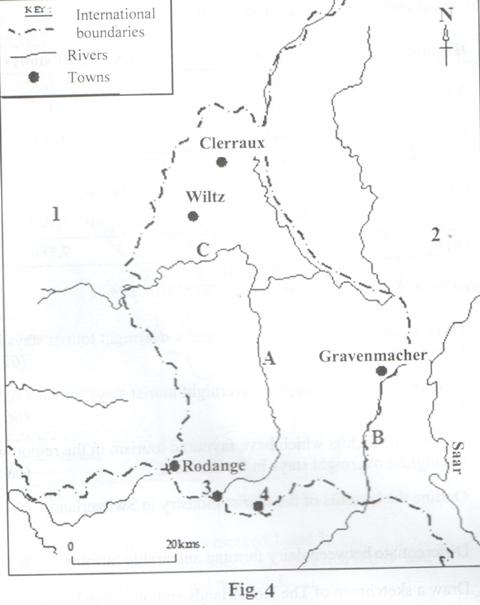
- Name the:
- rivers marked A, B and C
- neighboring countries marked 1 and 2
- iron and steel industrial centers marked 3 and 4
- Describe the factors which favored the development of iron and steel industries in the centers named in (a) (iii) above
- Explain the contribution of the industrial sector to the development of Luxembourg
- Outline the problems facing the industrial sector in Luxembourg.
REGION III: CHINA
11. Study table IV below, showing the population of the Yunnan province of China (1953- 2010) and answer the questions that follow.
|
Year |
Population (in millions) |
|
1953 1964 1982 1990 2000 2010 |
17.5 20.5 32.6 37.0 43.0 46.0 |
Table IV
Adapted: Demographic Statistics of China, http://en.wikipedia.org/wiki Demographics of China. Retrieved 7/24/14 11.18 am
- Calculate the percentage change in the population of the Yunnan Province of China between:
- 1953 and 1982
- 1990 and 2010
b. Draw a line graph to show the population trend in the Yunnan Province of China between 1953 and 2010.
c. Explain the factors which have led to the population trend in above.
d. Outline the population problems facing the Yunnan Province of China.
12. Draw a sketch map of China and on it, mark and name:
- i) towns: Kunmig, Tianjin and Shanghai
ii) the East China sea,
iii) rivers: Mekong, Sikiang and Hwang Ho
b. Describe the steps taken by China to develop the Sikiang river basin.
c. Explain the contribution of the Sikiang river basin to the development of China……
d. Outline the environmental problems that resulted from the development of the Sikiang river basin.
13. Study Figure 5, showing the location of Beijing (Peking) city and answer the questions that follow.

- Name the:
- water body marked 1 and 2
- canal marked 3
- towns marked A, B and C
- man-made feature marked D
- Explain the conditions which favored the location of Beijing city.
- Describe the functions of Beijing city
- Outline the steps being taken to solve the problems in Beijing city